OUR BLOG
The Governor’s Mansion
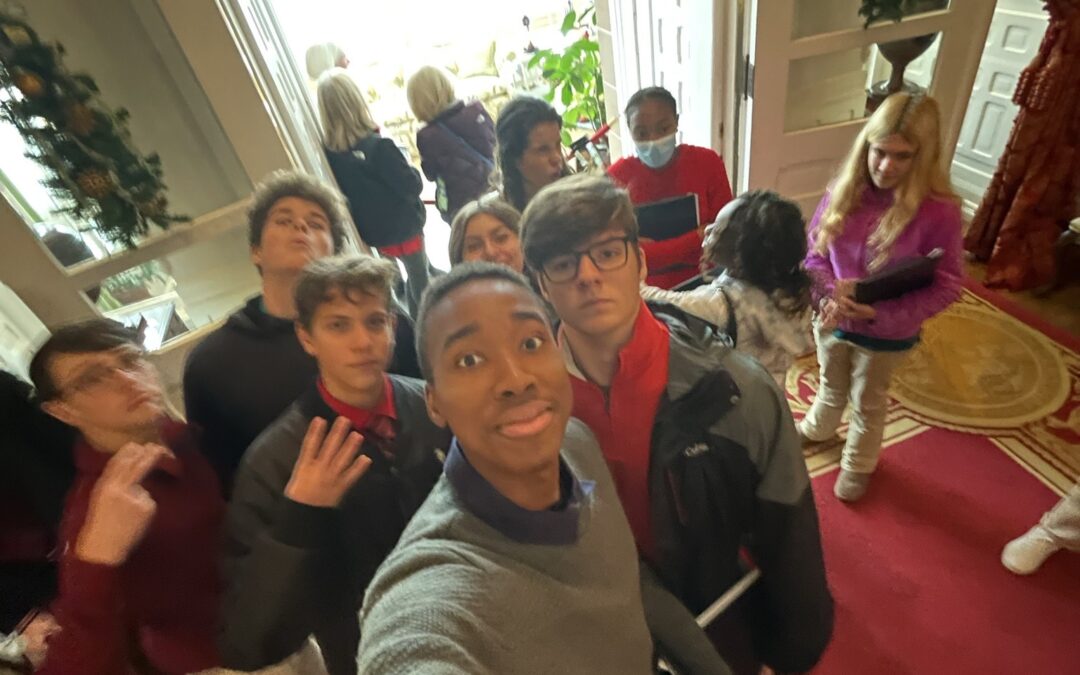
I, Eugene, had the opportunity to sing at the Governor's mansion with our school choir. The place was very pretty and had a very nice background of how it was built and how long they have been using it. I am so glad I could do this and hope to do more events like this...
Sum Arrays – Codewars
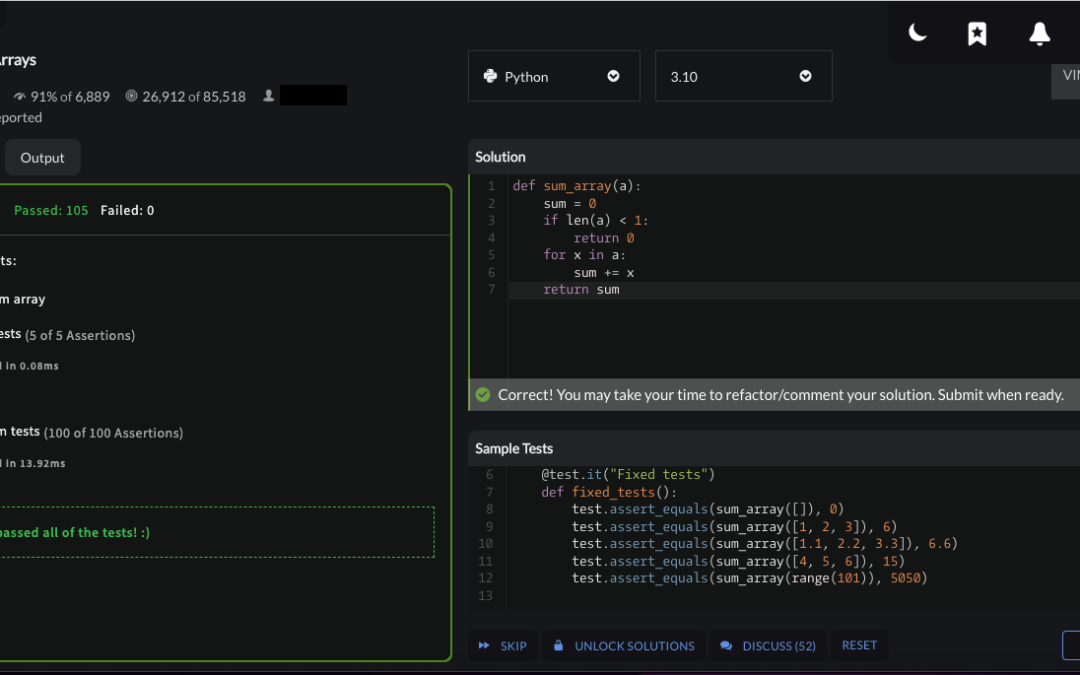
Today I completed the "Sum arrays" kata on Codewars! I started by making a for loop that runs through the contents of a given array. Then I defined a sum variable that adds all of the values together. Here is the final code!
“Welcome!” – Codewars
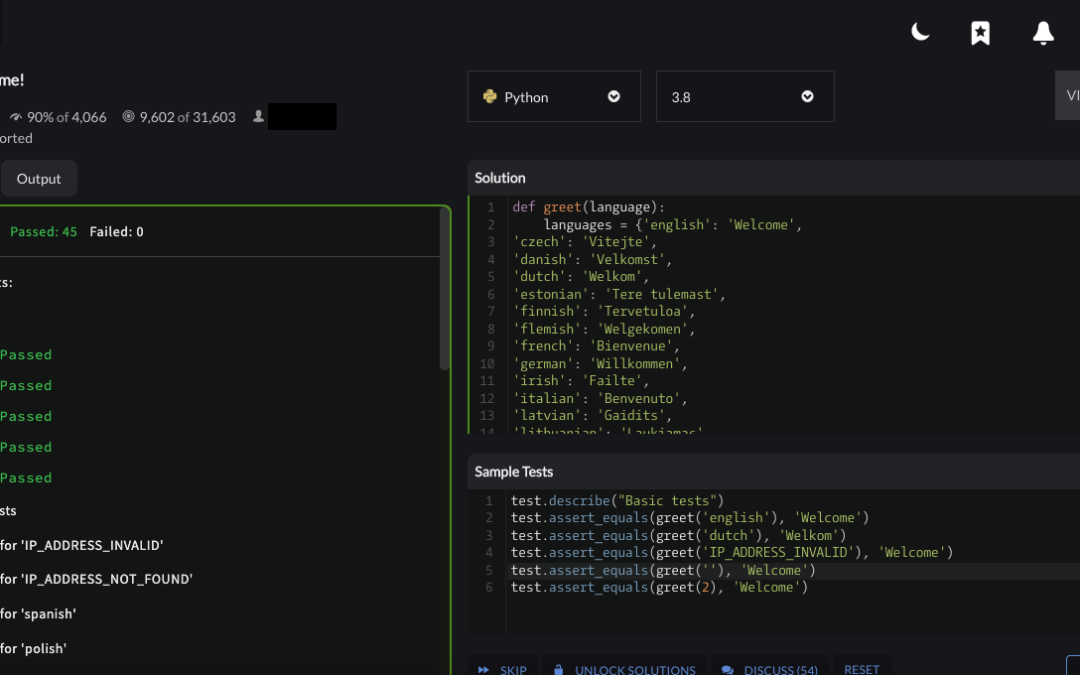
Today I completed the "Welcome!" kata on Codewars! I started by creating a database(hash) of languages and their welcome statements. Then I used the in keyword to check if the specified language was part of the database, and output the corresponding welcome message....
Thanksgiving
What are you thankful for? Thanksgiving can mean different things to everyone. It can be about being thankful for someone, it can be about the food that your family makes, or maybe even the people that you see and are connected with. Here is a video asking our fellow...
Thanksgiving 2022
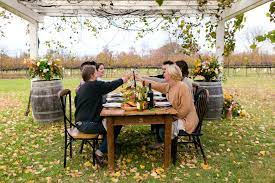
Thanksgiving is a special time of year when we all step back to count our blessings: good food, good friends, loving family. It's a time when we give thanks for all we have. Happy Thanksgiving!
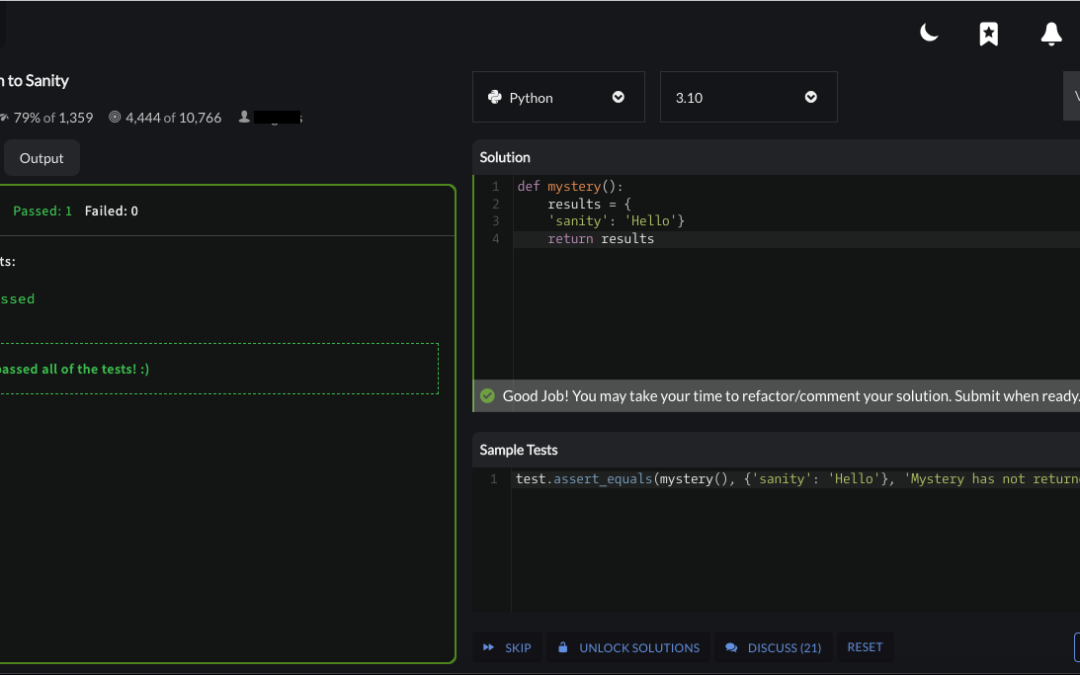
Return to Sanity – Codewars
Today I completed the "Return to Sanity" kata on Codewars!
Recent Comments